RCA & FMEA TRAINING
Root Cause Analysis and Failure Modes & Effects Analysis training by Sologic provides the tools, skills, and knowledge necessary to solve complex problems and manage risk in any sector, within any discipline, and of any scale.Learn More
SOFTWARE
Sologic’s cloud-based Causelink has the right software product for you and your organization. Choose from Individual, Team, or Enterprise.Learn More
Have you ever had to provide return on investment calculations while planning for a project? All major projects include some kind of ROI calculation during initial planning. The reason for this is clear – everyone wants to pick a winner. Negative returns are simply not acceptable.
If you’ve never done an ROI calculation, the basics are actually pretty simple.
- Add up the costs.
- Subtract the costs from the estimated returns.
- Divide by the original investment to get a percentage.
- If it’s positive, buy the team a round. If it’s negative, fire everyone involved.
You should be doing the same thing with root cause analysis, but there is one major twist: While the money you spend to investigate the problem and implement solutions is real, your returns equate to a reduction in risk. In other words, the problem cost you a lot of money and now you are going to spend a little more in order to reduce the risk of the problem happening again. Is this valid? Absolutely – we buy down risk every day! By incorporating an ROI calculation in your RCA, you will increase your credibility and provide decision makers with more accurate information. Read on to find out how to do it.
Calculating ROI for and RCA requires three variables:
- The actual financial impact of the problem (Cp)
- The actual cost of investigation (Ci)
- The estimated cost of solutions (Cs)
Then plug your figures into this equation.

Let’s look at some real numbers.
Example:
A dump truck overturned while dumping a load of gravel. The driver was not hurt, but could have been killed.

Notice that I left off the non-financial impact items, as well as the potential impact (fatality). I certainly care about those things – but let’s just stick to the math for now.
Next we need to calculate the amount of money we spent investigating.

And finally, we need to add up the cost of proposed solutions.

Now we just plug the numbers to determine the ROI:

This is quite a return – you’d be rich overnight if you could earn this sort of return on any other investment. But that’s not how we interpret these numbers. What this really says is that we wish to invest an additional $13,250 ($6,000 + $7,250) to reduce the risk of future occurrence of a problem that cost us $1,250,000. If I were the decision maker, it would seem like smart money to me. But of course it would depend on whether or not I could trust the information being presented. The thing is, even if the impact assessment was 50% high and the solutions estimate was 100% low, this would still be a good investment – so long as the solutions actually did prevent problem recurrence.
That’s where the fundamentals of RCA come into play. If you have an accurate cause and effect chart, your causes are based on high-quality evidence, and your solutions control multiple causes (especially non-transitory causes), then you greatly increase the validity of your ROI calculation.
Let’s complicate things just a little bit by adding in frequency. If you see a problem recurring, you need to estimate an aggregate impact of the overall problem. The easiest way to do this is to simply multiply the problem impact by the frequency of the problem. This will give you a rough estimate of overall ROI. But if you want to tighten up the numbers, and you have the information available, just add the actual impact for each problem. At this point, you aren’t actually calculating the ROI for a single problem, but for a class of problems. The investigation may be longer. And, given the higher comparable costs, you may decide to recommend solutions that are more expensive – yet better at reducing risk.
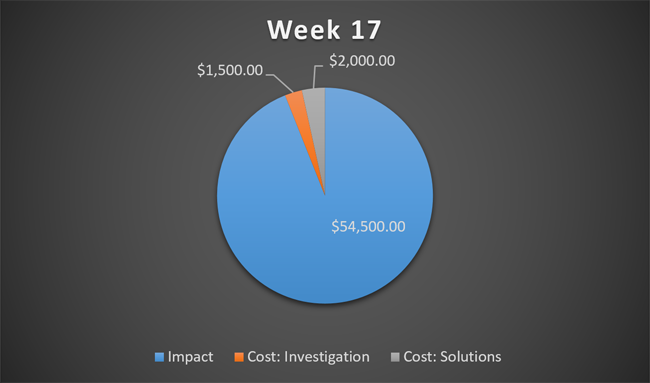
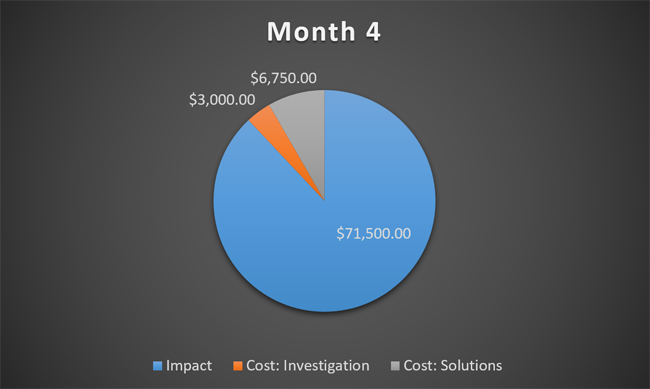
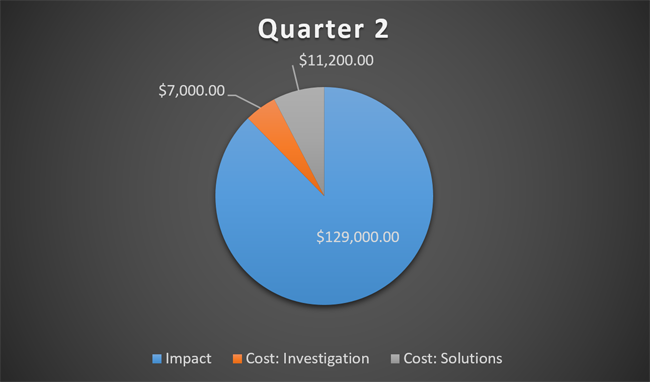
So far, we’ve been discussing ROI of single problems and of classes of problems. But once you have the data, you can calculate RCA Program ROIs for different time periods (monthly, quarterly, annually). You can also divide it up by regions, business units, or by area of responsibility (safety, quality, reliability, operations, etc.). You could even calculate ROI by Facilitator to see who is using their RCA training in the most beneficial way.
Let’s circle back to non-financial ROI. In the example above, we discussed a dump truck overturning, which almost killed the driver. We don’t express ROI for qualitative impacts in terms of absolute dollars. Instead, we’d just state that for our $13,250 investment, we will dramatically reduce the risk of an accident of this type occurring in the future.
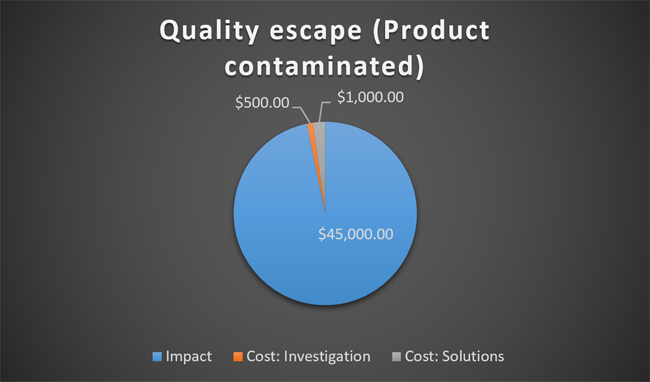
A pie chart is a nice way to represent this data. You’ll need to log the chart data – I just keep an Excel file that looks like this:

Then I run a pivot table to sort the data how I want it.
Here are a few examples of charts:
ROI: Individual RCA:
ROI: Single Week:
ROI: Single Month:
ROI: Single Quarter
ROI: Entire Year
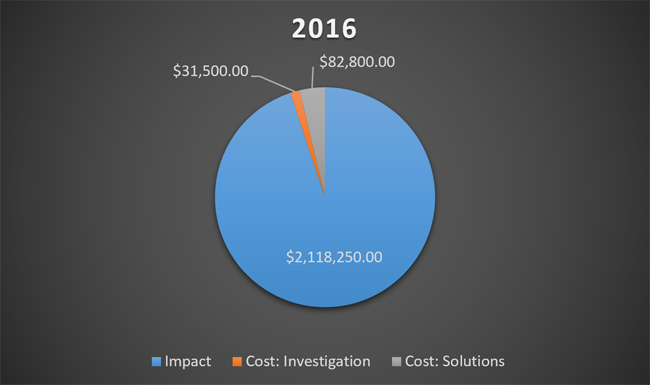
I read these charts like this: We spent the impact already. We are going to spend some money on solutions for the problem whether we conduct an RCA or not. Are we willing to spend just a little bit more money investigating to help guarantee that the money we spend on solutions will be effective?
To sum all this up, with a little effort on your part you can provide your managers and decision makers with actionable ROI information. If you do, you’ll greatly increase the value of your RCAs as well as your own clout as an RCA investigator. And, having seen how useful this information is, we will be programing ROI calculations directly into Causelink.
As always, give us a ring if we can help.
Learn more about Sologic RCA
RCA & FMEA TRAINING
Root Cause Analysis and Failure Modes & Effects Analysis training by Sologic provides the tools, skills, and knowledge necessary to solve complex problems and manage risk in any sector, within any discipline, and of any scale.Learn More
SOFTWARE
Sologic’s cloud-based Causelink has the right software product for you and your organization. Choose from Individual, Team, or Enterprise.Learn More